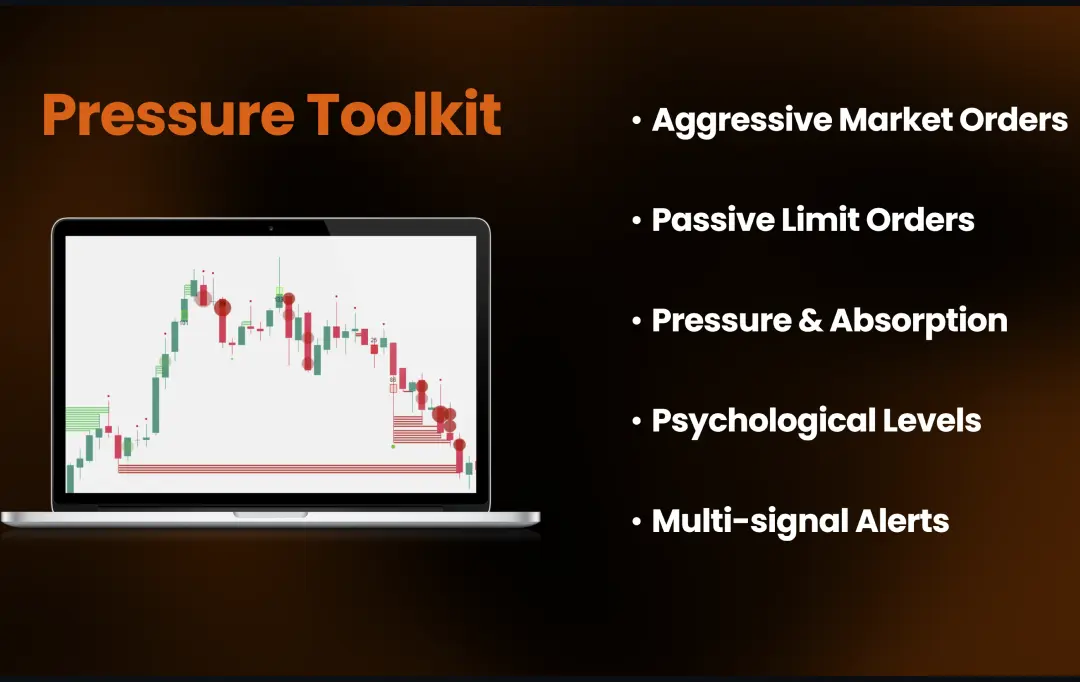
Pressure Toolkit is a custom volume-based order flow indicator that reads footprint/cluster chart data to detect buying and selling pressure at the price level.
Core Features
Pressure Bubbles — detects buying/selling pressure, distinguishing between dim (weak) and bright (strong) marks.
Big Trade Detection — highlights when an unusually large trade coincides with a pressure bubble, showing the exact price and volume.
Absorption Dots & Lines — identifies when high volume is being absorbed in wicks, with enhanced dots for statistically significant absorption events.
Psychological Levels — adaptive round number levels that automatically scale to any instrument price.
Full Alert System — separate live alerts for bubbles, big trades, absorption dots, absorption lines, and psychological level crosses.
How It Works
Pressure Toolkit analyses bid and ask volume at every price level within each candle to detect where aggressive order flow and absorption occur.
Pressure Bubbles identify candles where strong buying or selling pressure is concentrated, with brighter markers indicating greater activity intensity. When an unusually large trade coincides with a bubble, it gets highlighted with the exact price and volume displayed.
Absorption dots and lines detect significant volume absorbed in candle wicks, with lines marking the specific price levels where this occurs and extending forward until the price returns to test them.
Psychological levels automatically calculate relevant round number prices for any instrument and generate alerts when the price crosses them in real time.
Customization & Alerts
Pressure Toolkit works on all timeframes. Traders can adjust the sensitivity of each indicator function, and alerts can be enabled for all available features.
Use Case
For ATAS Users
15% discount with promo code: PRO15
A company that develops educational software, providing chart indicators and other analytical tools. Enhance the effectiveness of your strategies with ProfitPro's advanced tools.

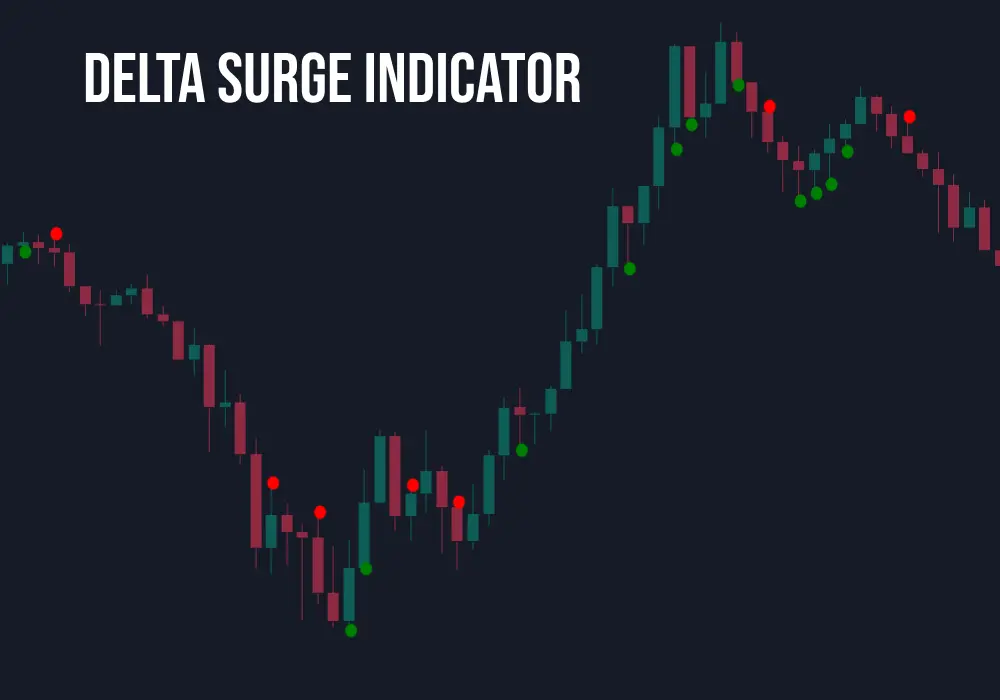
The Delta Surge indicator highlights moments when the delta within candlesticks shows a significant increase or decrease over a set number of consecutive bars.
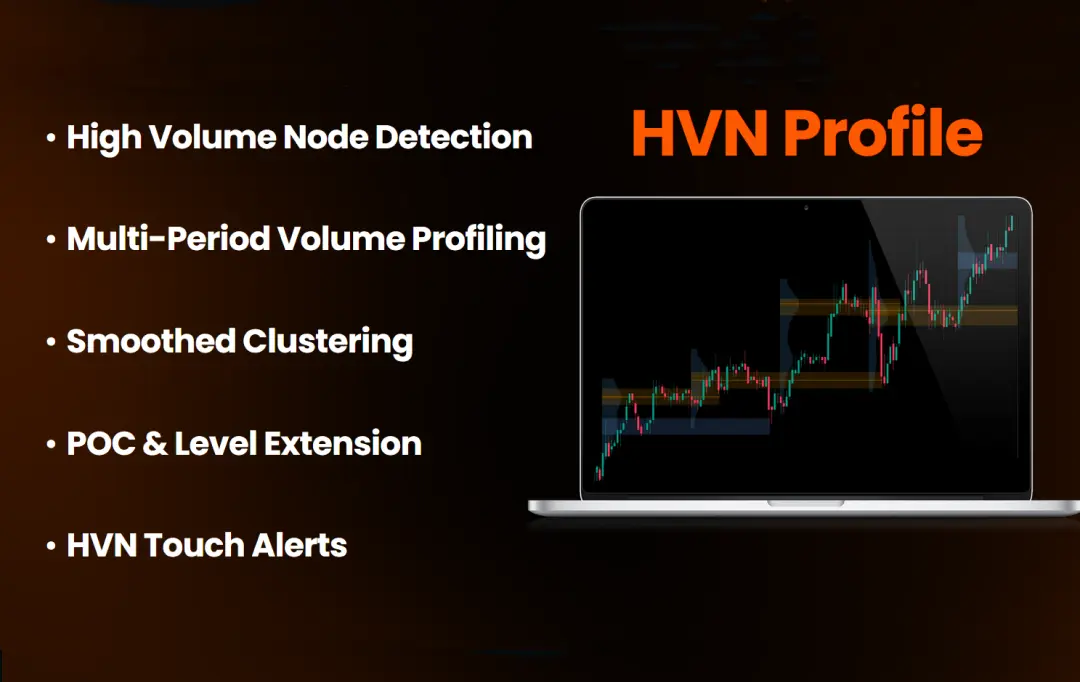
HVN Profile is a high‑volume node-mapping tool that identifies key volume clusters that act as support/resistance, with alerts when price reacts to those levels.
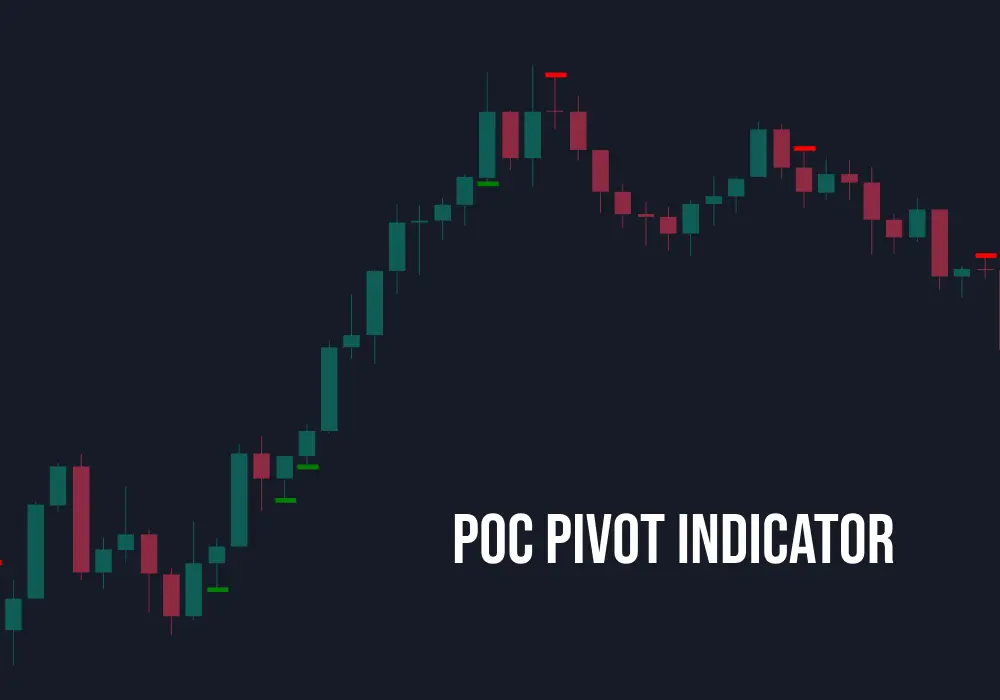
The POC Pivot indicator identifies prominent points of control, highlighting areas where volume is highly directional.
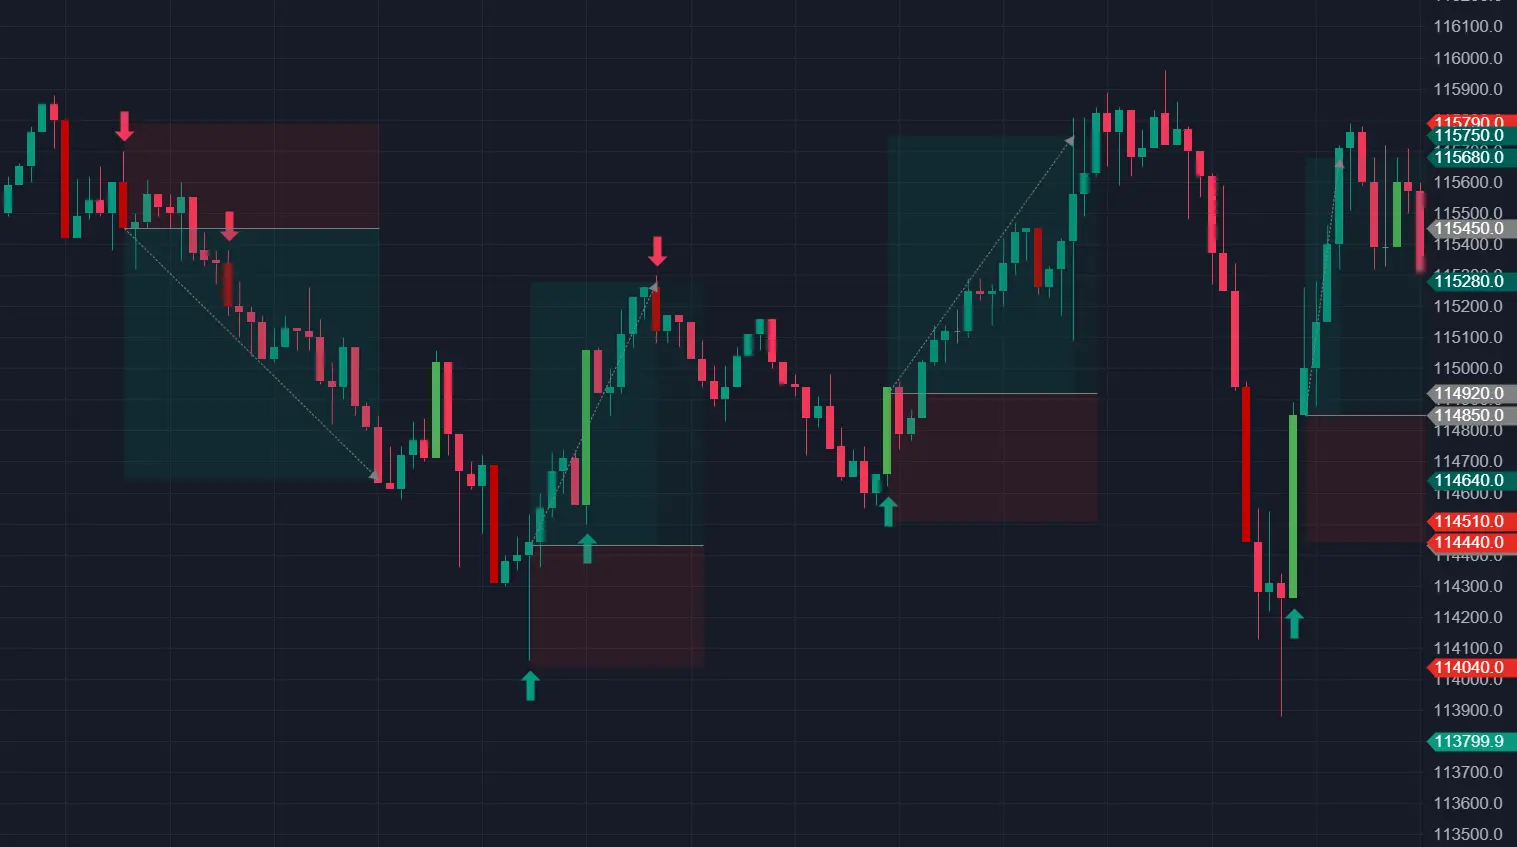
The Pulse indicator displays bullish and bearish arrows derived from bid/ask data. It features four toggleable indication types, customizable alert options, and adjustable sensitivity settings to create personalized trade indications.
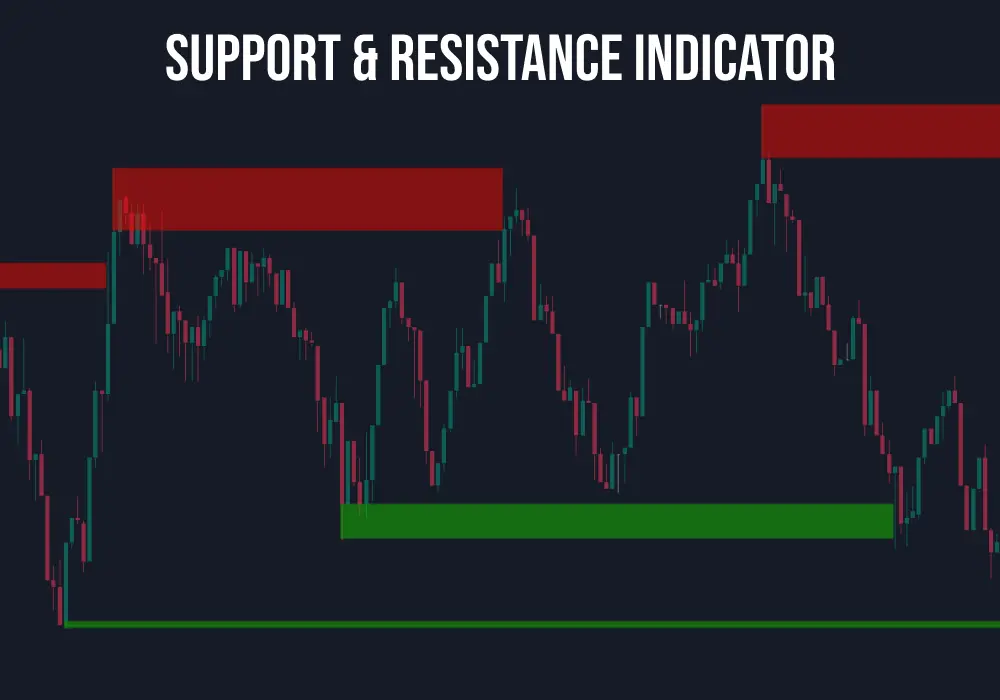
A precision support and resistance indicator that identifies naked swing levels in real-time, a valuable tool for breakout and reversal strategies.
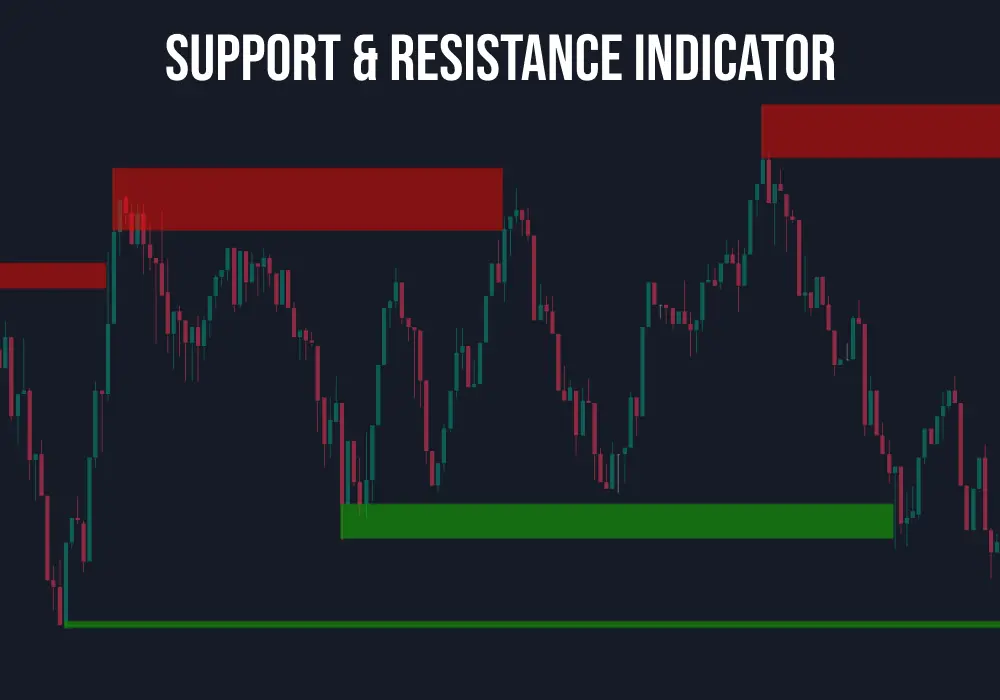
A precision support and resistance indicator that identifies naked swing levels in real-time, a valuable tool for breakout and reversal strategies.
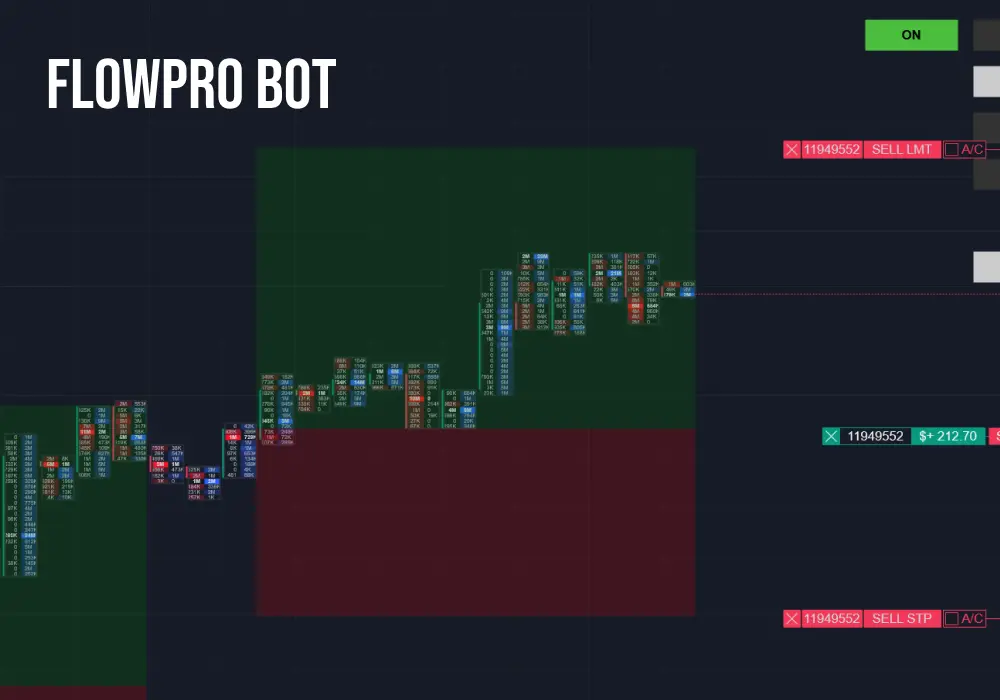
Automated order execution tool for crypto and futures markets, powered by market pressure analysis. Executes trades when market pressure matches your pre-configured conditions, with automatic stop-loss and take-profit placement.